")
")
Open Access
Figure 11
Download original image
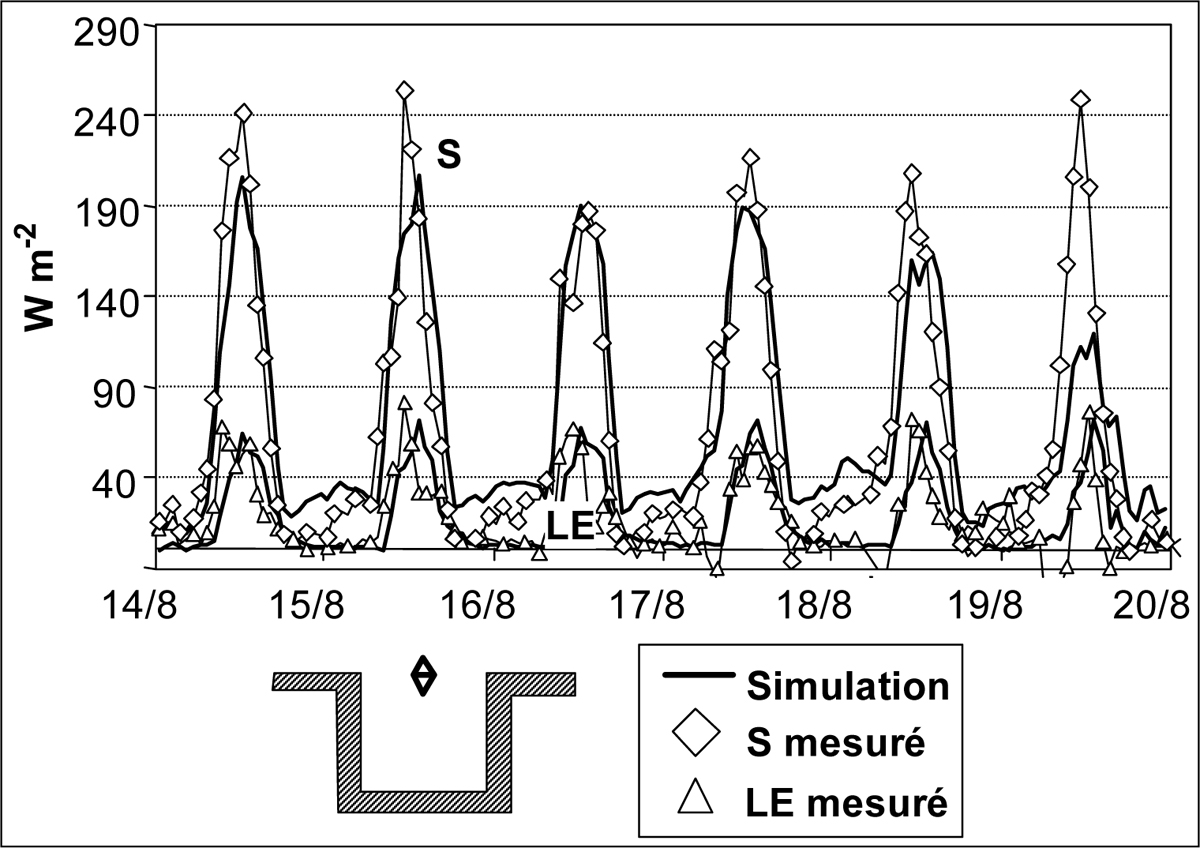
Les flux de chaleur au sommet du canyon pour des journées allant du 14 au 19 août. Les flux sont représentés après lissage par une moyenne mobile d’ordre 6. Heat fluxes at the canyon top for the period between August 14 to 19. The fluxes are averaged over a 1.5 hour period.
Current usage metrics show cumulative count of Article Views (full-text article views including HTML views, PDF and ePub downloads, according to the available data) and Abstracts Views on Vision4Press platform.
Data correspond to usage on the plateform after 2015. The current usage metrics is available 48-96 hours after online publication and is updated daily on week days.
Initial download of the metrics may take a while.