")
")
Open Access
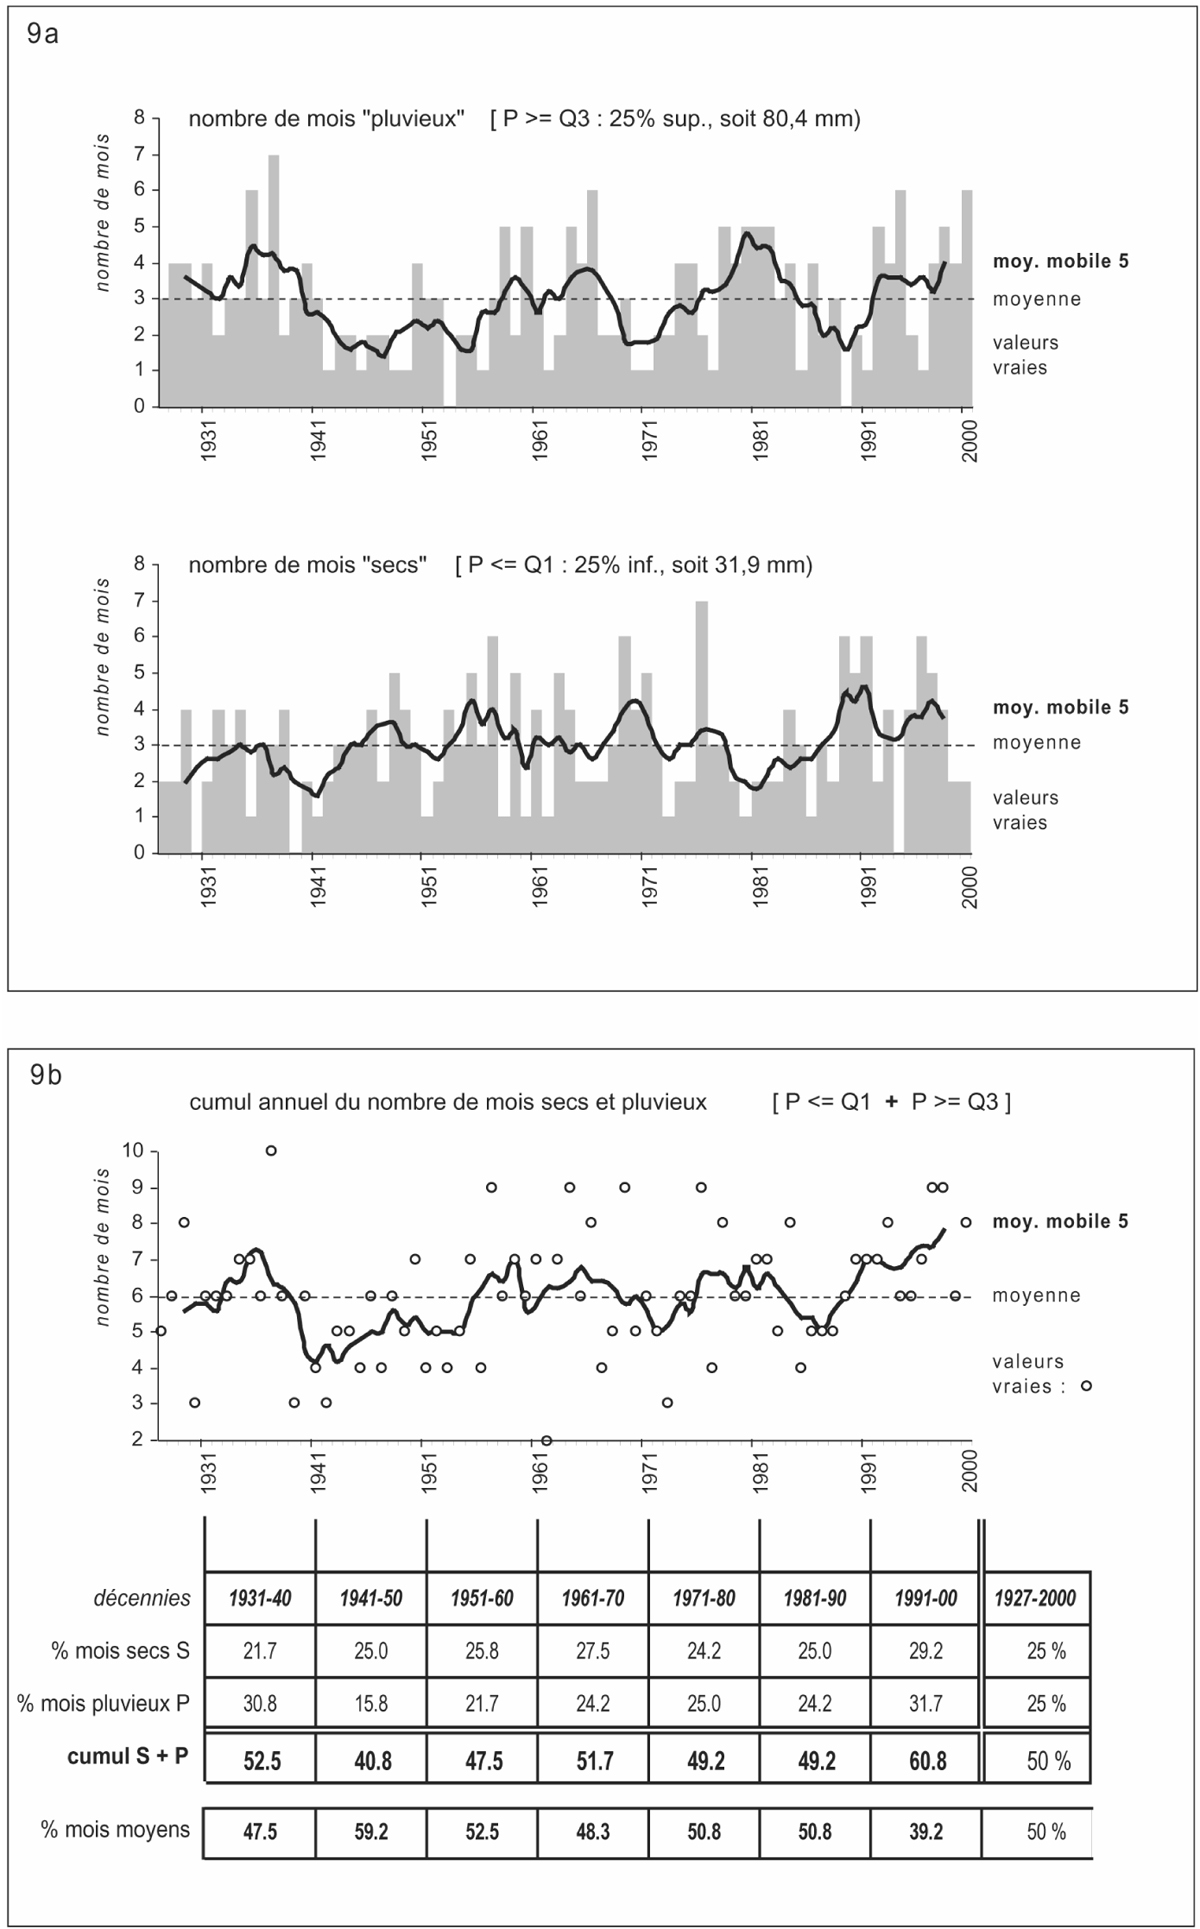
Figure 9
Download original image
Evolution du nombre de mois secs et pluvieux à Caen entre 1927 et 2000. Evolution of dry and rainy months in Caen between 1927 and 2000.
Current usage metrics show cumulative count of Article Views (full-text article views including HTML views, PDF and ePub downloads, according to the available data) and Abstracts Views on Vision4Press platform.
Data correspond to usage on the plateform after 2015. The current usage metrics is available 48-96 hours after online publication and is updated daily on week days.
Initial download of the metrics may take a while.