")
")
Figure 8
Download original image
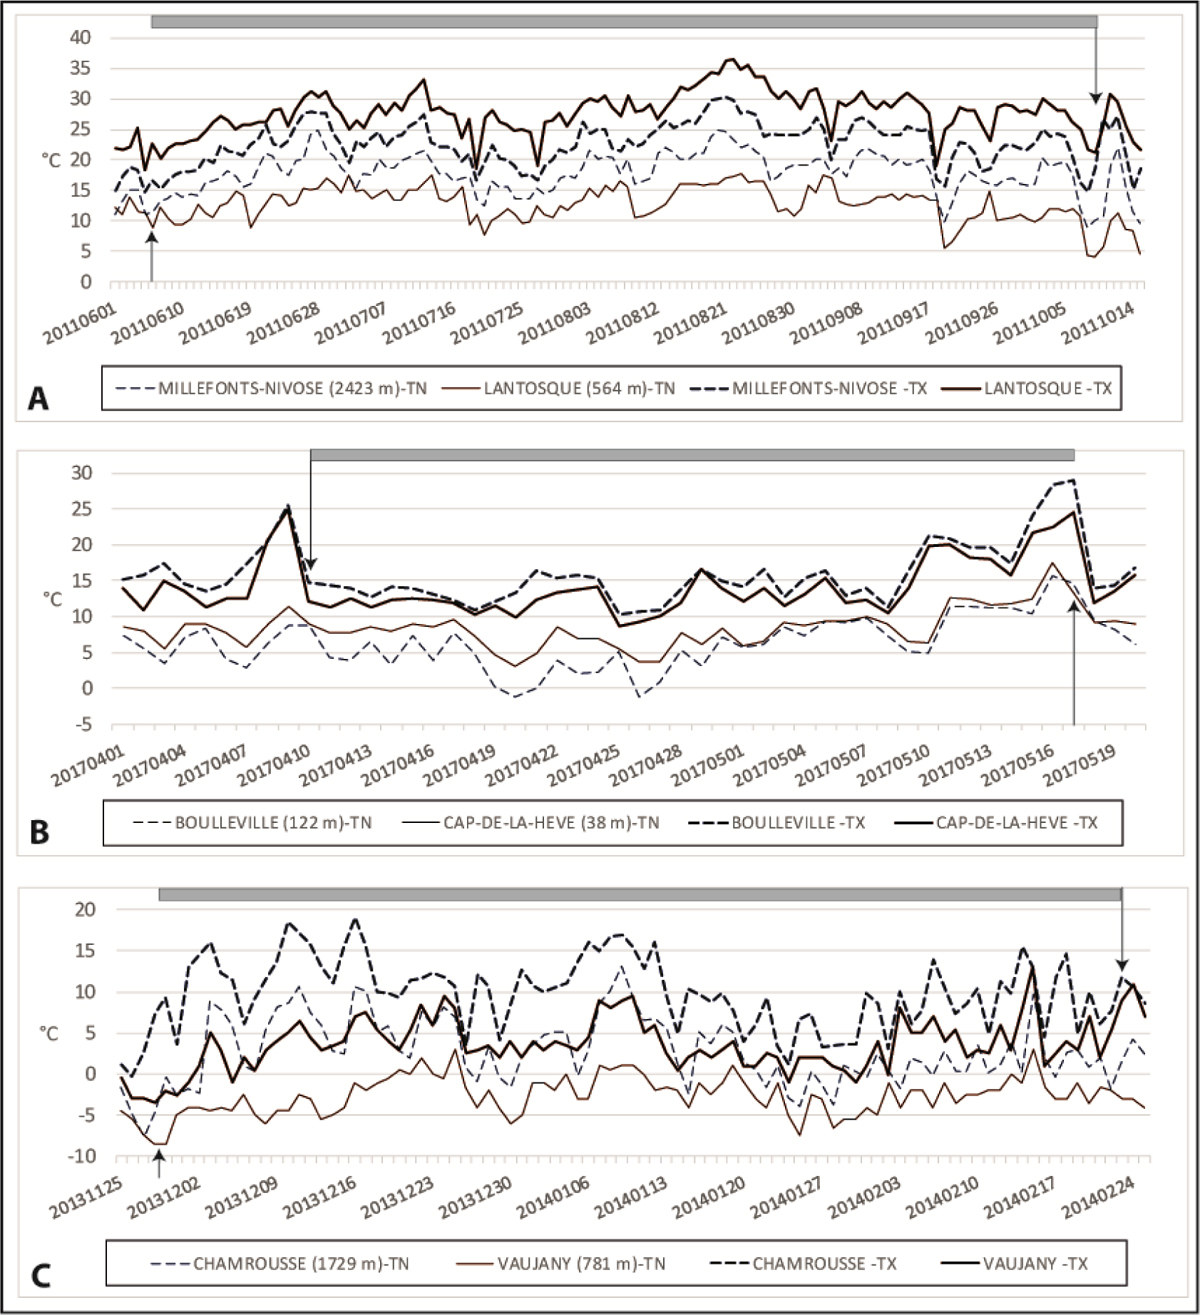
Tn and tx temperatures at the low station and high station of three sites. Dashed line = top station, solid line = bottom station; the arrows mark the beginning and the end of the inversion, the grey bar indicates the period of time during which the inversion lasted: 126 days, from 6 June to 9 October 2011 for the longest tn-sequence (A), 37 days, from 9 April to 17 May 2017 for the longest tx-sequence (B), and 88 days from 28 November 2013 to 23 February 2014 for the longest persistent inversion (C).
Températures tn et tx à la station basse et à la station haute de trois sites. Ligne pointillée = station supérieure, ligne pleine = station inférieure; les flèches marquent le début et la fin de l’inversion, la barre grisée indique le laps de temps au cours duquel l’inversion a duré : 126 jours, du 6 juin au 9 octobre 2011 pour la séquence-tn la plus longue (A), 37 jours, du 9 avril au 17 mai 2017 pour la séquence-tx la plus longue (B) et 88 jours du 28 novembre 2013 au 23 février 2014 pour l’inversion persistante la plus longue (C).
Current usage metrics show cumulative count of Article Views (full-text article views including HTML views, PDF and ePub downloads, according to the available data) and Abstracts Views on Vision4Press platform.
Data correspond to usage on the plateform after 2015. The current usage metrics is available 48-96 hours after online publication and is updated daily on week days.
Initial download of the metrics may take a while.