")
")
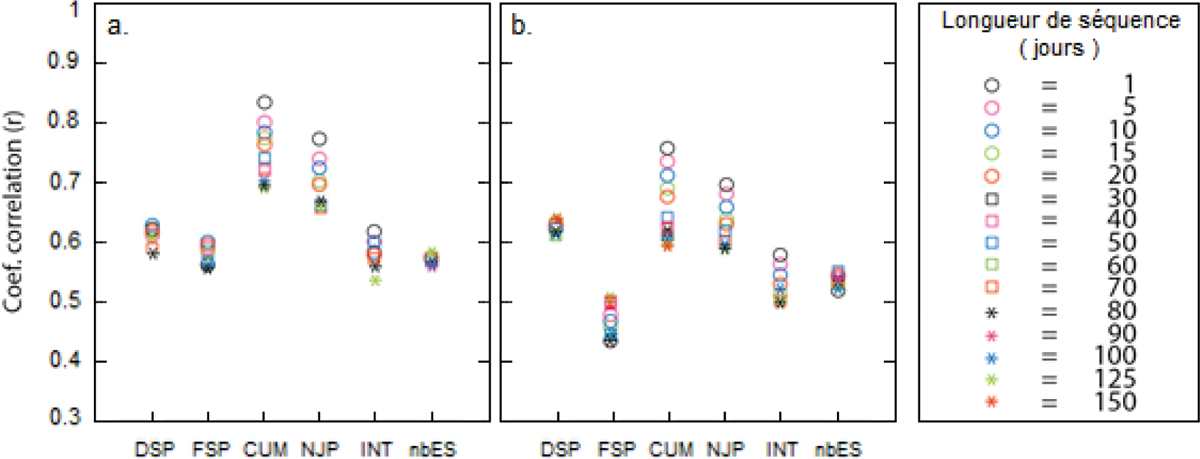
Figure 9
Download original image
: Évolution des corrélations en fonction de la longueur des séquences manquantes (en nombre de jours consécutifs) pour les long rains (a) et short rains (b). Le pourcentage de manques est fixé à 30 % de la base de données initiale. DSP est la date de Démarrage de Saison des Pluies, FSP est la Fin de Saison des Pluies, CUM correspond au CUMul saisonnier, NJP au Nombre de Jour de Pluie, INT est l’INTensité quotidienne moyenne des pluies et nbES est le nombre d’Episodes Secs. Correlation coefficient distribution according to the length of missing periods for the long rains season (a) and short rains season (b). The percentage of total missing values is 30% of the initial database. DSP is the onset date of rainy season, FSP is the cessation date of rainy season, CUM corresponds to seasonal amount, NJP is the number of rainy day, INT is the mean daily rainfall intensity and nbES indicate the number of dry spells.
Current usage metrics show cumulative count of Article Views (full-text article views including HTML views, PDF and ePub downloads, according to the available data) and Abstracts Views on Vision4Press platform.
Data correspond to usage on the plateform after 2015. The current usage metrics is available 48-96 hours after online publication and is updated daily on week days.
Initial download of the metrics may take a while.