")
")
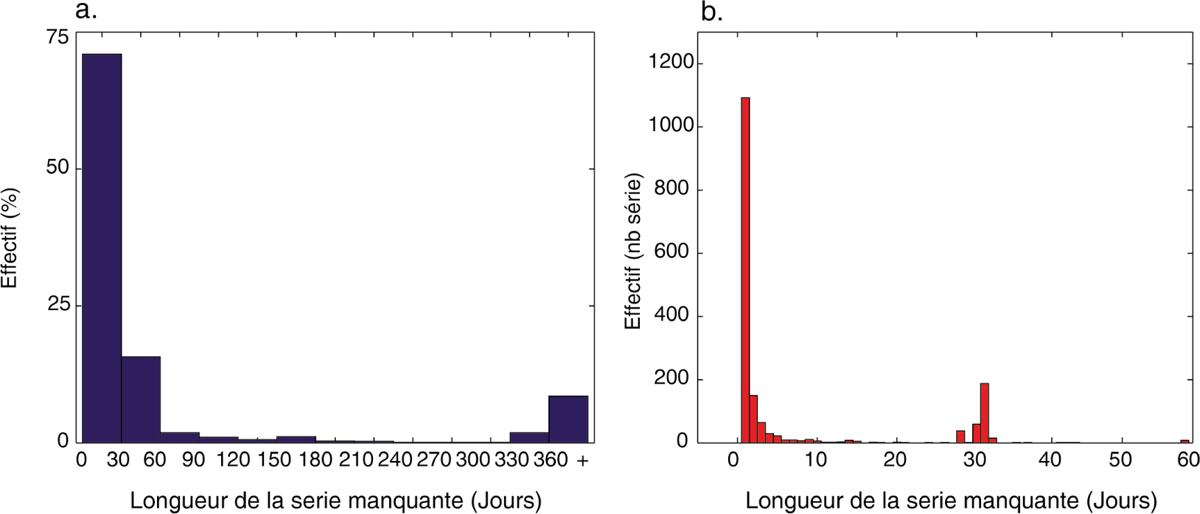
Figure 3
Download original image
Histogrammes de fréquence simple montrant la longueur des séries de valeurs manquantes consécutives et leur répartition en classes d’égales amplitudes de trente jours (a) et unitaire (b) pour les stations du réseau Kenya et Tanzanie du Nord pour la période 1961-2001. Distribution of length of missing values series from equal amplitudes classes of thirty days (a) and unit day (b) for Kenyan and northern Tanzanian stations over the period 1961-2001.
Current usage metrics show cumulative count of Article Views (full-text article views including HTML views, PDF and ePub downloads, according to the available data) and Abstracts Views on Vision4Press platform.
Data correspond to usage on the plateform after 2015. The current usage metrics is available 48-96 hours after online publication and is updated daily on week days.
Initial download of the metrics may take a while.