")
")
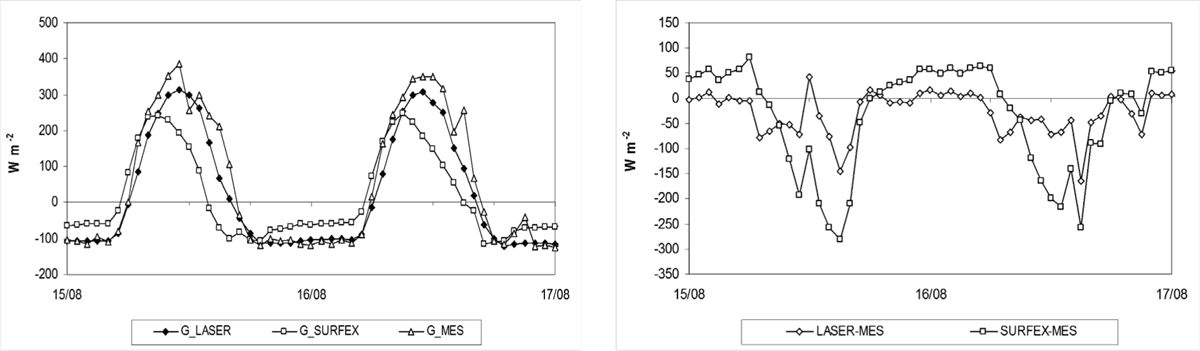
Figure 10
Download original image
Graphique de gauche : flux de chaleur dans le sol simulé par les modèles (G_LASER, G_SURFEX) comparé à celui qui a été déduit des mesures (G_MES). Graphique de droite : écarts constatés entre le flux de chaleur dans le sol simulé et mesuré (LASER-MES, SURFEX-MES). Graph on the left: simulated ground heat flux (G_LASER, G_SURFEX) compared to the measurements (G_MES). Graph on the right: differences between the simulated and measured ground heat fluxes (LASER-MES, SURFEX-MES).
Current usage metrics show cumulative count of Article Views (full-text article views including HTML views, PDF and ePub downloads, according to the available data) and Abstracts Views on Vision4Press platform.
Data correspond to usage on the plateform after 2015. The current usage metrics is available 48-96 hours after online publication and is updated daily on week days.
Initial download of the metrics may take a while.