")
")
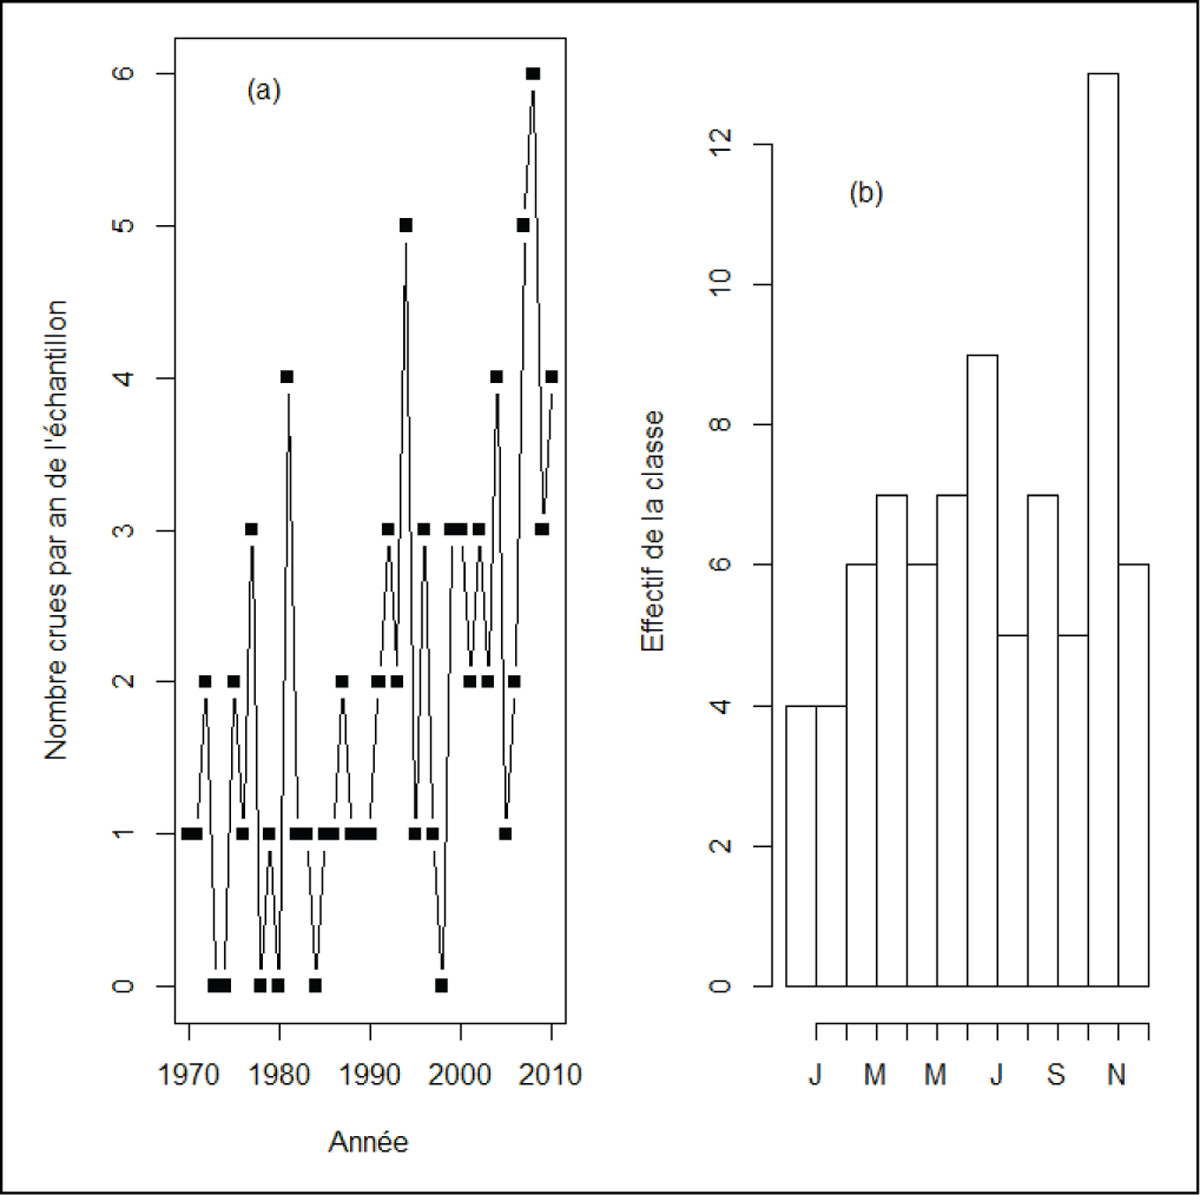
Figure 5
Download original image
a) Nombre de crues par an à la station de Craponne; b) Saisonnalité des crues. L’échantillon de crues a été obtenu par échantillonnage sub-seuil à deux crues par an sur la période 1970-2010. a) Number of floods per year at the Craponne station; b) Seasonality of the floods. The flood sample was obtained using a sub-threahold sampling with two floods per year in the period 1970-2010.
Current usage metrics show cumulative count of Article Views (full-text article views including HTML views, PDF and ePub downloads, according to the available data) and Abstracts Views on Vision4Press platform.
Data correspond to usage on the plateform after 2015. The current usage metrics is available 48-96 hours after online publication and is updated daily on week days.
Initial download of the metrics may take a while.