")
")
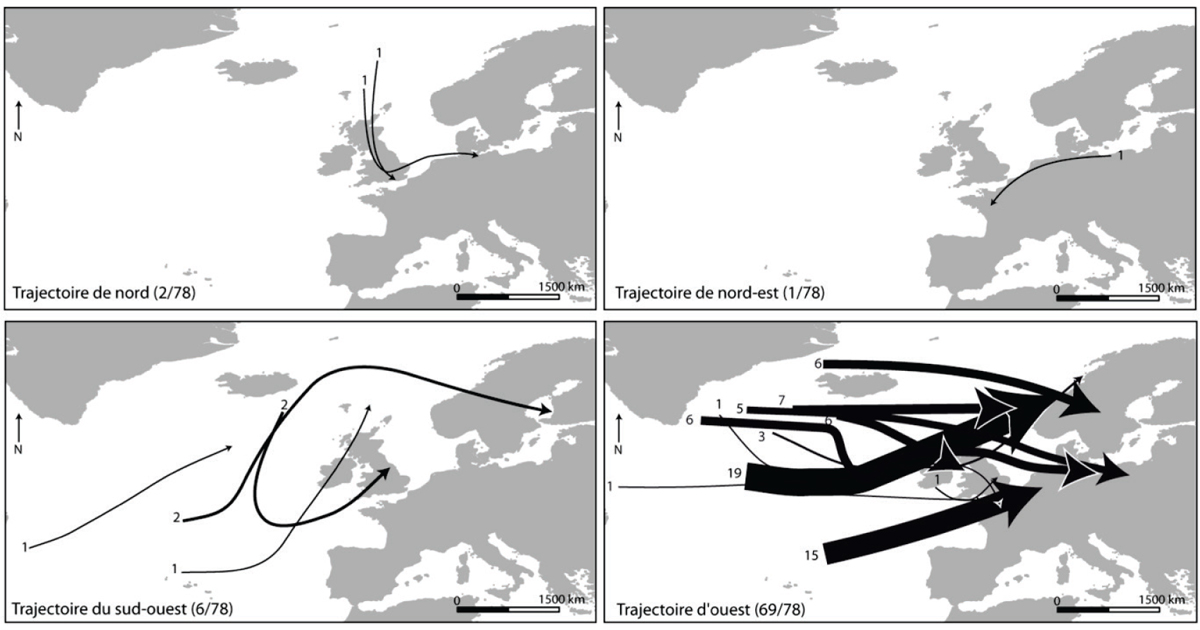
Figure 17
Download original image
Trajectoires des centres dépressionnaires ayant provoqué des submersions (toutes intensités confondues) (l’épaisseur de la flèche varie en fonction du nombre de submersions marines). Trajectories of low air pressure centres ending in coastal flooding events (all degrees of severity) (thickness of the arrow evolves in function of the number of coastal flooding events).
Current usage metrics show cumulative count of Article Views (full-text article views including HTML views, PDF and ePub downloads, according to the available data) and Abstracts Views on Vision4Press platform.
Data correspond to usage on the plateform after 2015. The current usage metrics is available 48-96 hours after online publication and is updated daily on week days.
Initial download of the metrics may take a while.