")
")
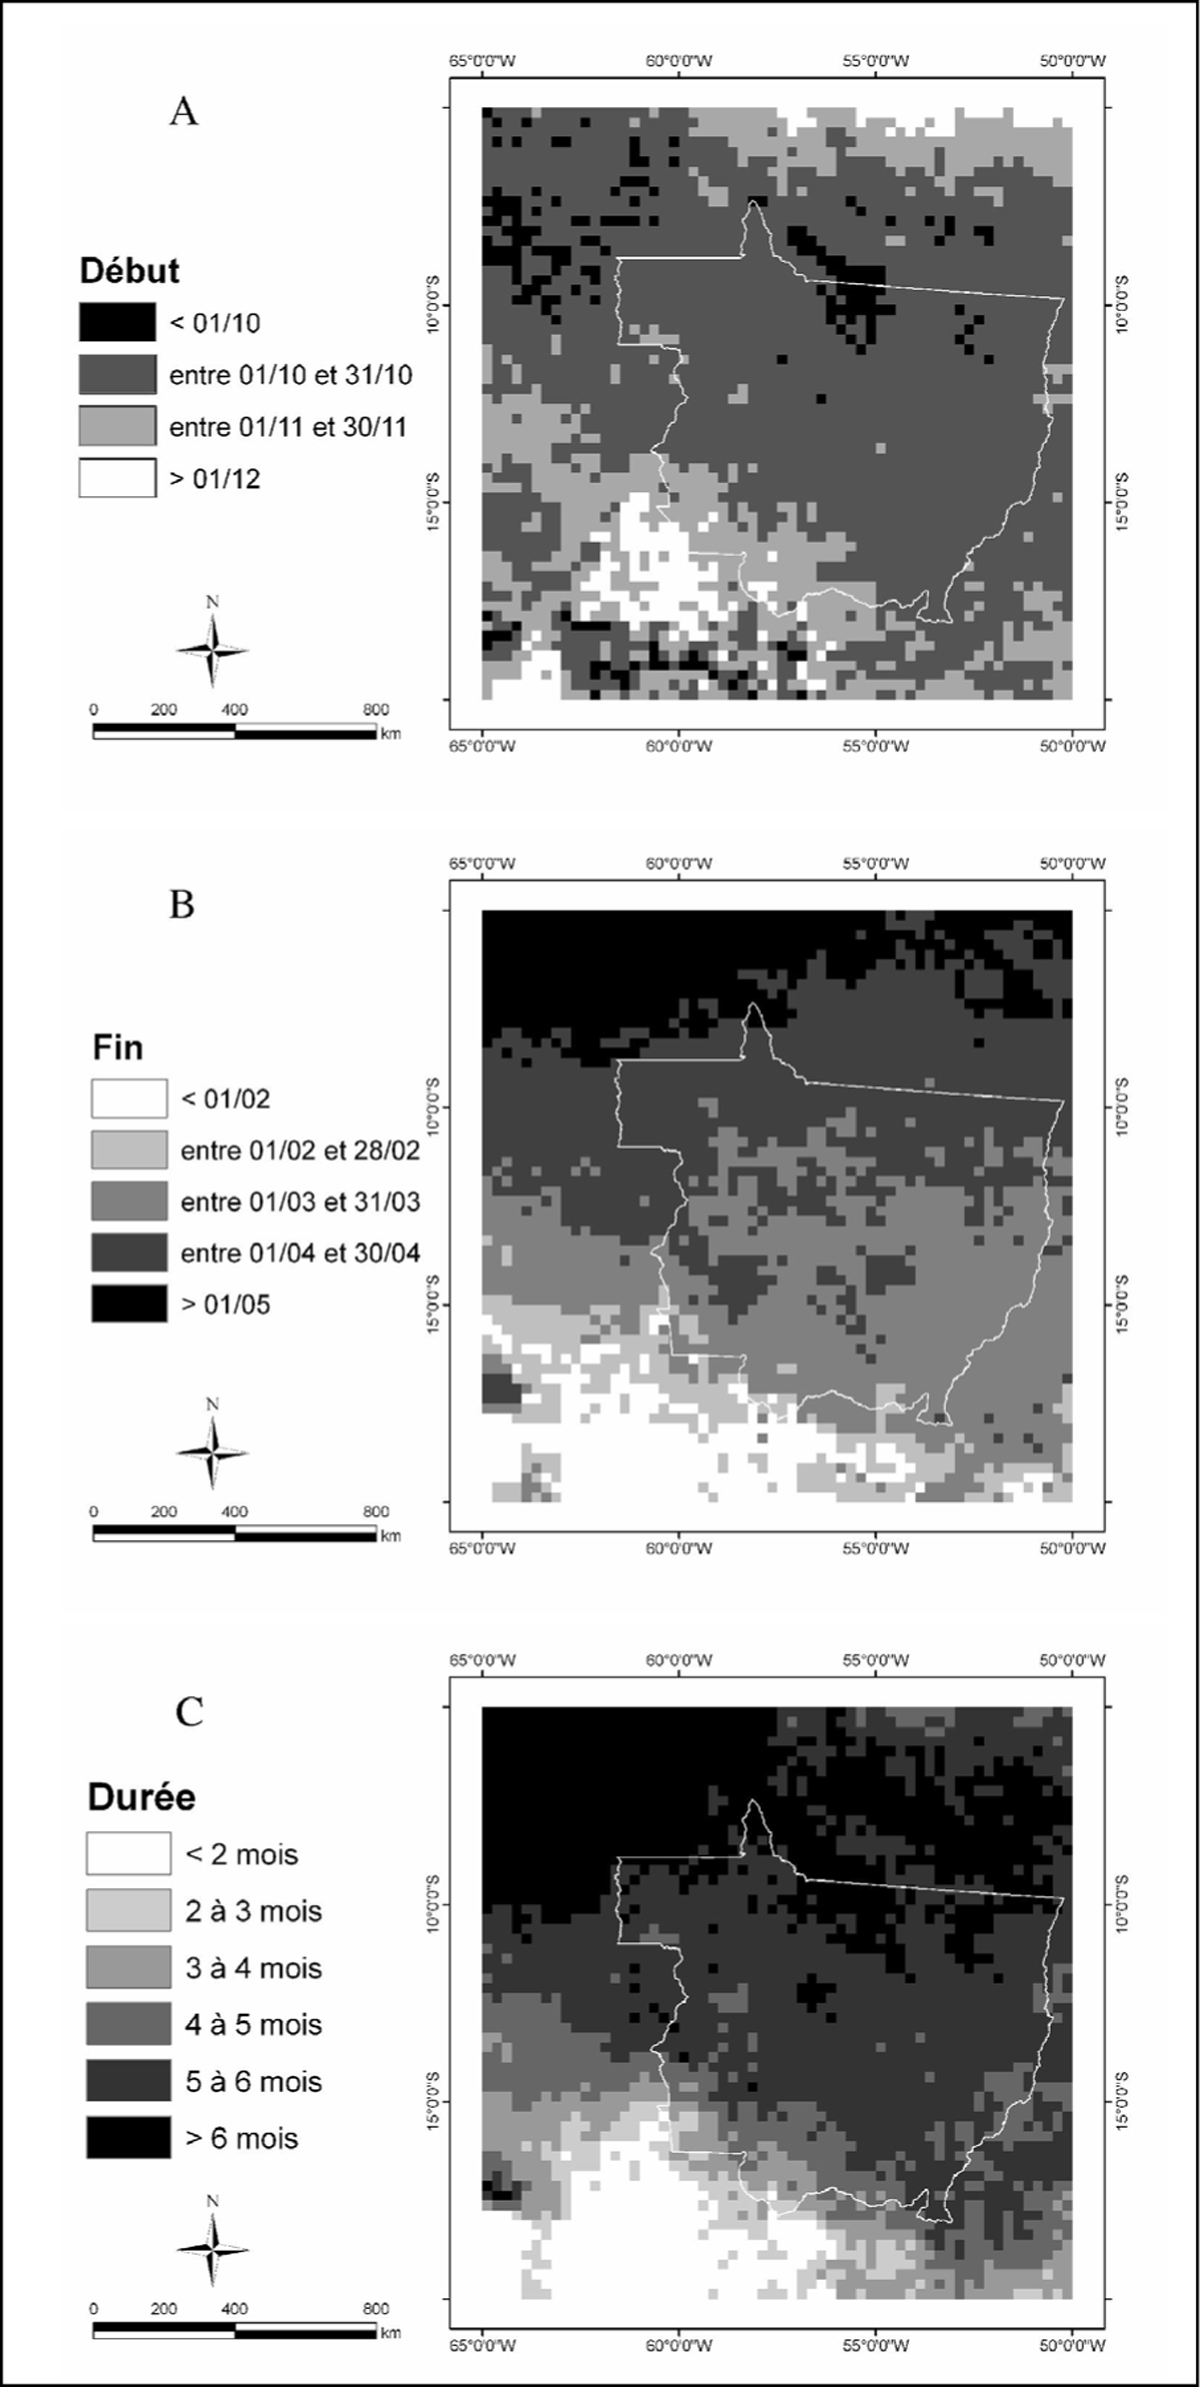
Figure 5
Download original image
Cartes des paramètres de la saison des pluies calculés à partir de la méthode « Anomalous Accumulation » (Liebmann, 2006), avec un seuil égal à 5,1 mm (moyenne 1998-2006) : dates de début (A) et fin (B) de la saison des pluies, durée de la saison des pluies (C). Maps of the rainy season parameters calculated using the « Anomalous Accumulation » method (Liebmann, 2006), with a 5.1 mm threshold (1998-2006 average): dates of onset (top) and end (centre) of the rainy season are presented as well as its duration (bottom).
Current usage metrics show cumulative count of Article Views (full-text article views including HTML views, PDF and ePub downloads, according to the available data) and Abstracts Views on Vision4Press platform.
Data correspond to usage on the plateform after 2015. The current usage metrics is available 48-96 hours after online publication and is updated daily on week days.
Initial download of the metrics may take a while.