")
")
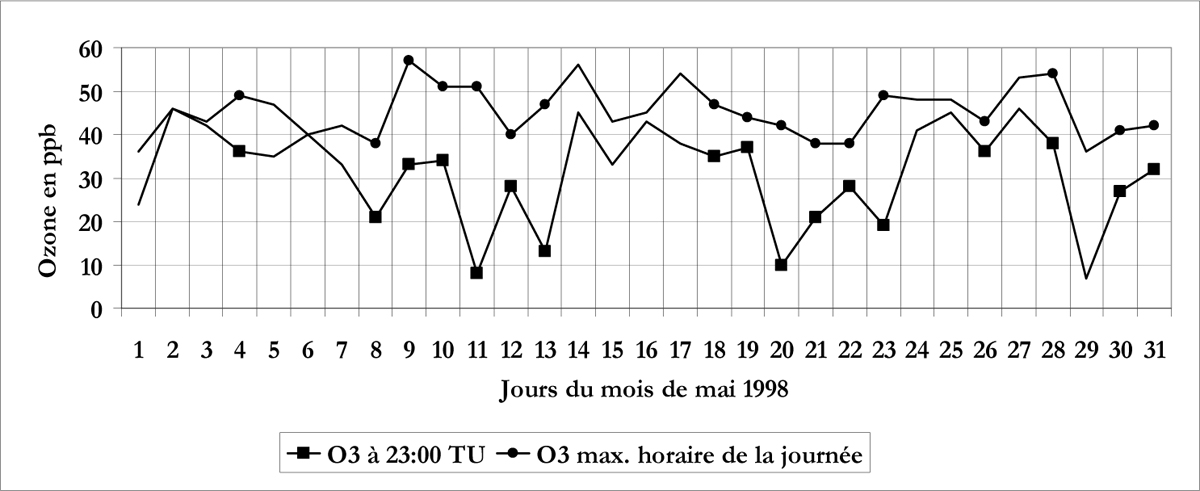
Figure 20
Download original image
Niveaux de pollution à l’ozone à 23h00 TU et valeurs des pics journaliers de pollution à l’ozone à Ben Arous au cours du mois de mai 1998. Les symboles indiquent les journées à inversion de température. Levels of ozone pollution at 11 p.m and values of daily ozone pollution’ peaks during May 1998. The patterns indicate the days with temperature inversions.
Current usage metrics show cumulative count of Article Views (full-text article views including HTML views, PDF and ePub downloads, according to the available data) and Abstracts Views on Vision4Press platform.
Data correspond to usage on the plateform after 2015. The current usage metrics is available 48-96 hours after online publication and is updated daily on week days.
Initial download of the metrics may take a while.