")
")
Open Access
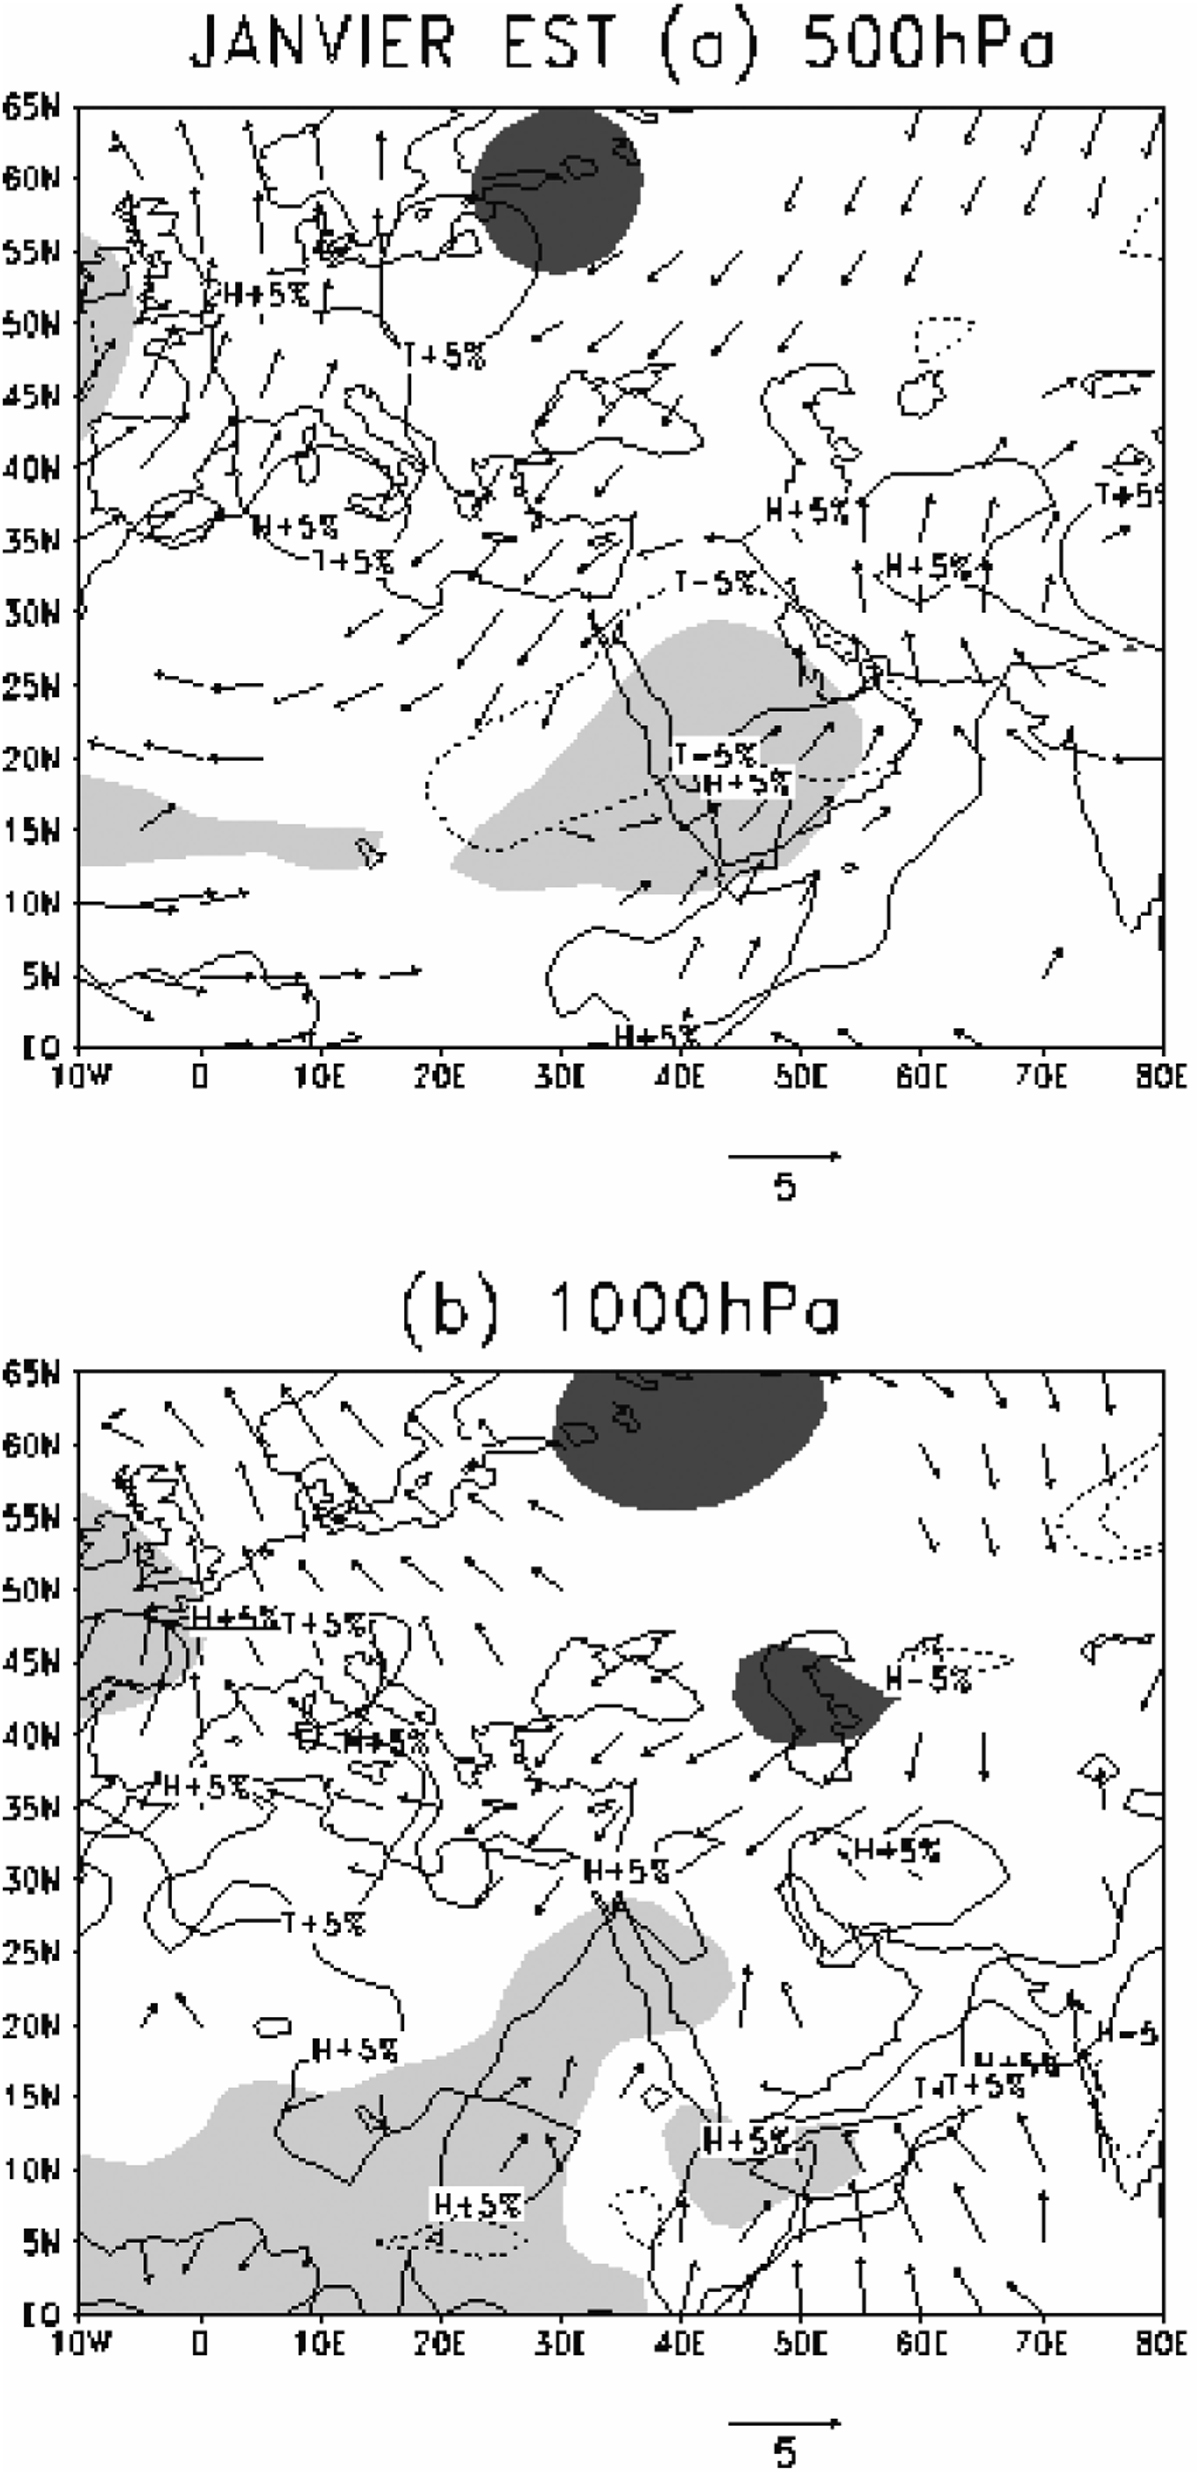
Figure 6
Download original image
idem figure 4, pour le mois de janvier dans la région est. Same as figure 4, but for the month of January in the eastern region.
Current usage metrics show cumulative count of Article Views (full-text article views including HTML views, PDF and ePub downloads, according to the available data) and Abstracts Views on Vision4Press platform.
Data correspond to usage on the plateform after 2015. The current usage metrics is available 48-96 hours after online publication and is updated daily on week days.
Initial download of the metrics may take a while.