")
")
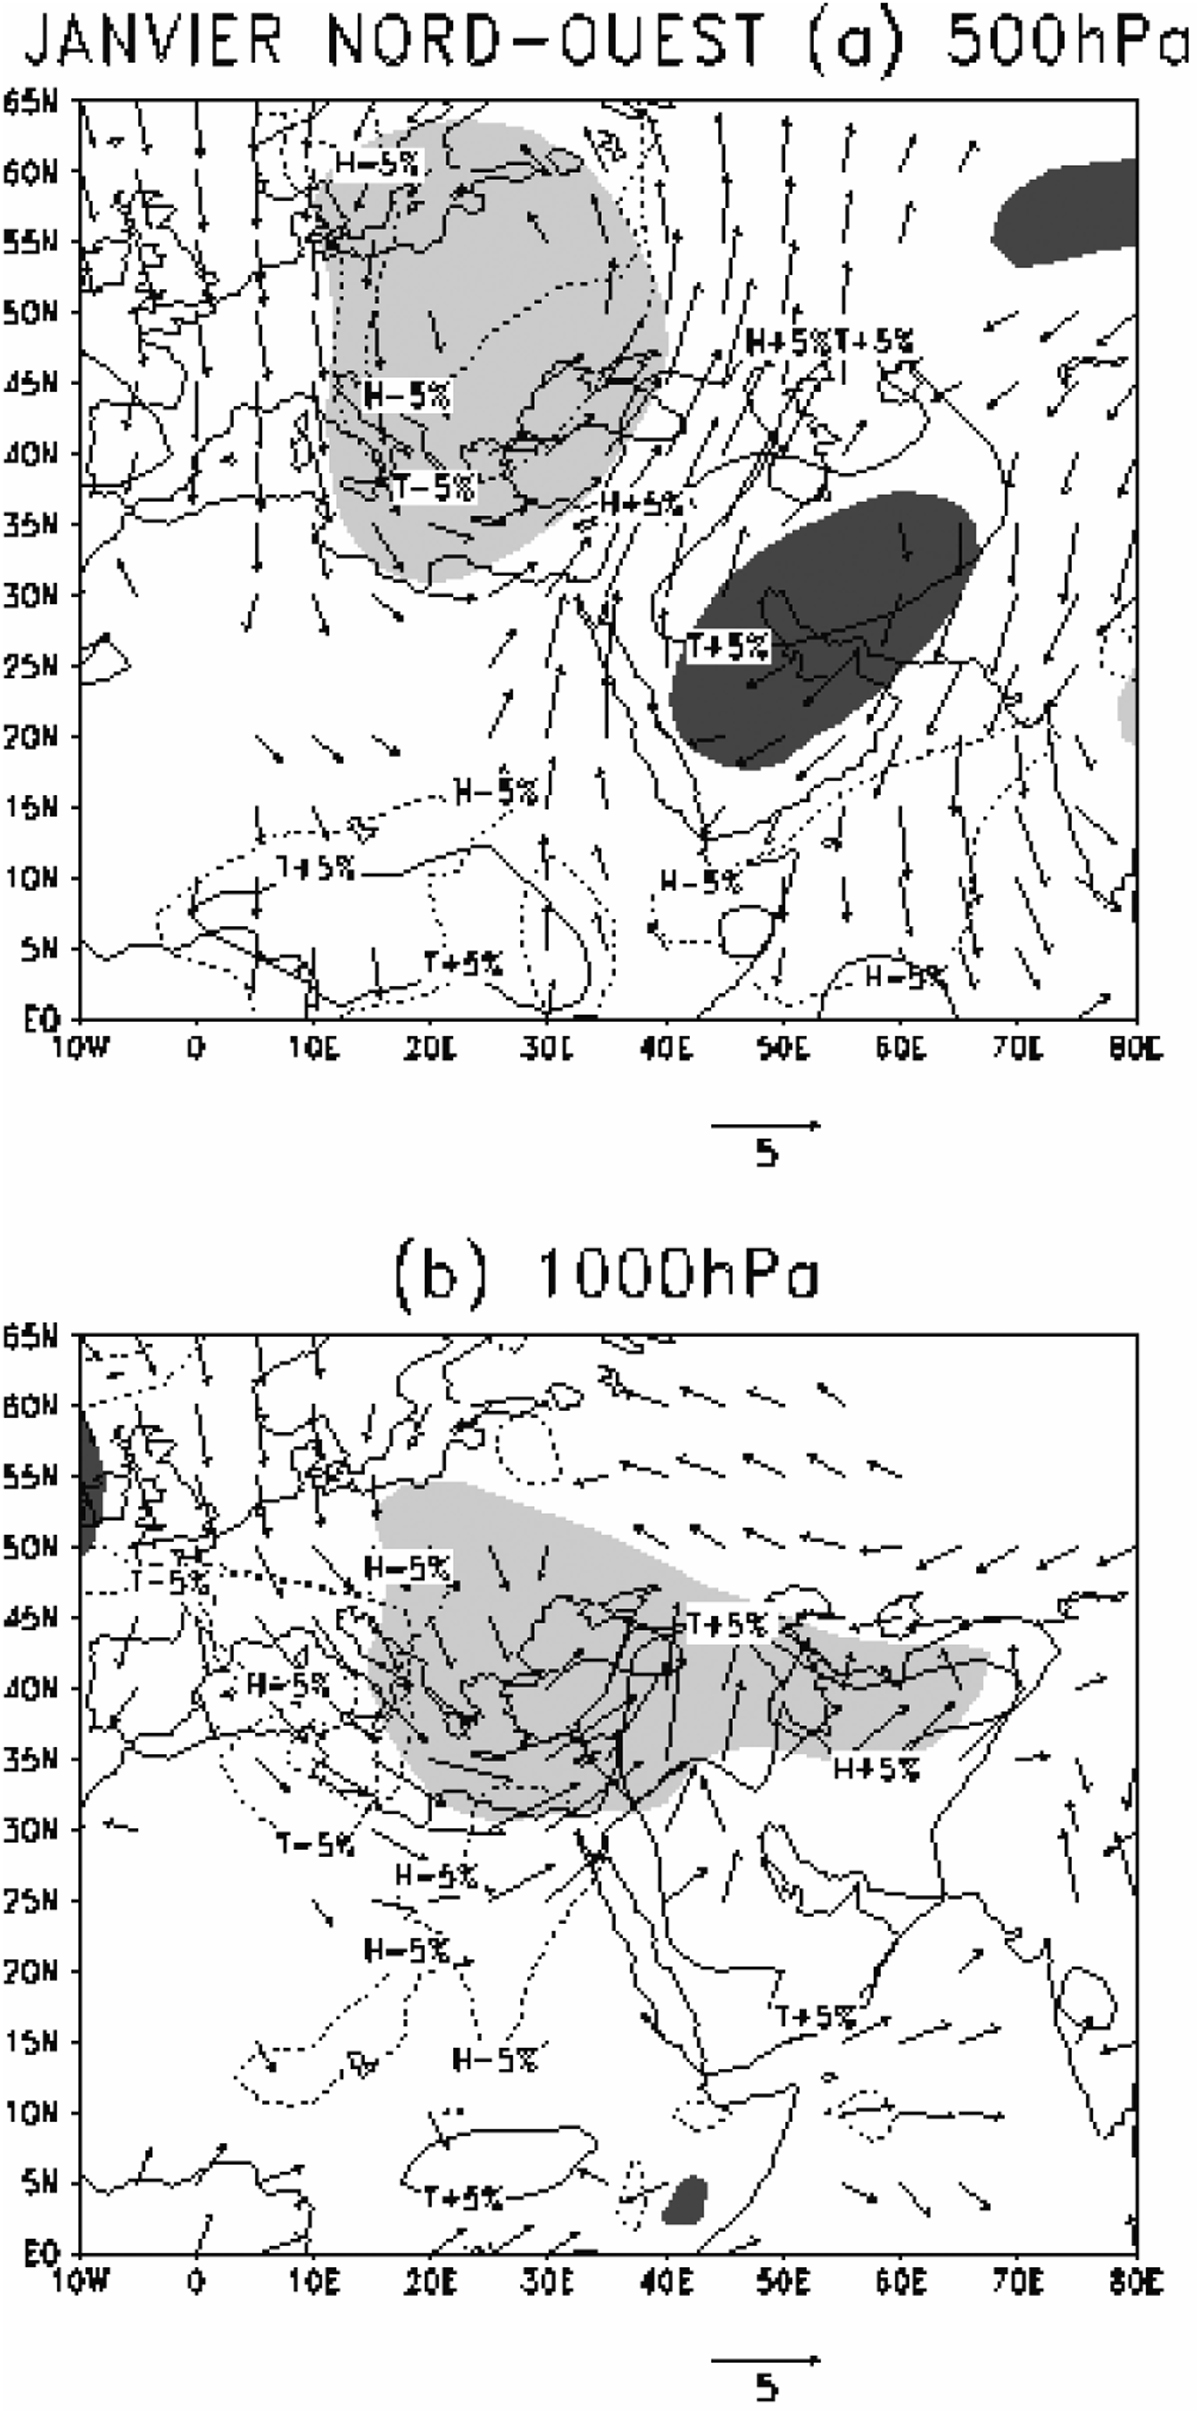
Figure 4
Download original image
Anomalies atmosphériques correspondant à une composite années pluvieuses moins années sèches pour janvier dans la région nord-ouest : (a) moyenne troposphère (500 hPa); (b) basse troposphère (1 000 hPa). Seules sont représentées les anomalies significatives au seuil de 5 %. Vecteurs : vents. Grisé : géopotentiel (gris sombre : anomalies positives; gris clair : anomalies négatives). Isolignes épaisses : humidité spécifique; isolignes fines : température (trait plein : anomalies positives; tiretés : anomalies négatives). Atmospheric anomalies corresponding to a wet minus dry composite for January in the north-western region: (a) mid-troposphere (500 hPa), (b) lower troposphere (1 000 hPa). Only those anomalies significant at the 5% level are shown. Vectors: winds. Shaded: géopotentiel heights (dark grey: positive anomalies; light grey: negative anomalies). Bold contours: specific humidity; light contours: temperature (solid: positive anomalies; dashed: negative anomalies).
Current usage metrics show cumulative count of Article Views (full-text article views including HTML views, PDF and ePub downloads, according to the available data) and Abstracts Views on Vision4Press platform.
Data correspond to usage on the plateform after 2015. The current usage metrics is available 48-96 hours after online publication and is updated daily on week days.
Initial download of the metrics may take a while.